Live demo
From ambiguity to clarity
How Precision Striping — a ~$6M pavement striping contractor — turned scattered QuickBooks data into a single source of truth with AM2.
Illustrative demo built on synthetic data for a fictional company — no real client information is shown.
Interactive product tour
Drive the app behind the numbers
The dashboard above is the readout — this is the estimating app that captures the data behind it. Every field the crew fills in the lot — stalls, square footage, service mix, bid status — is a field the dashboard reports on, with no re-keying in between. Click through a real estimate: adjust the scope, follow the bid math, and email yourself the sample quote it produces.
Interactive product tour · sample data
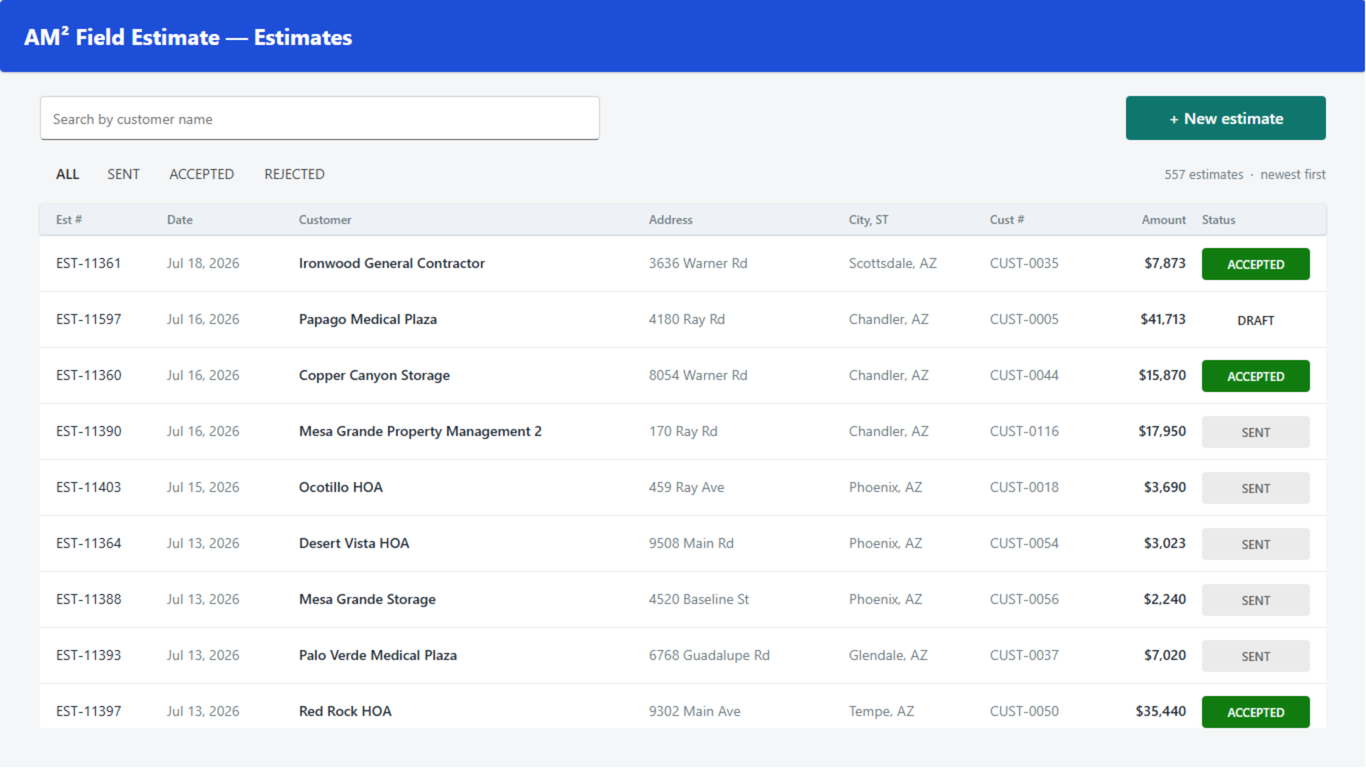
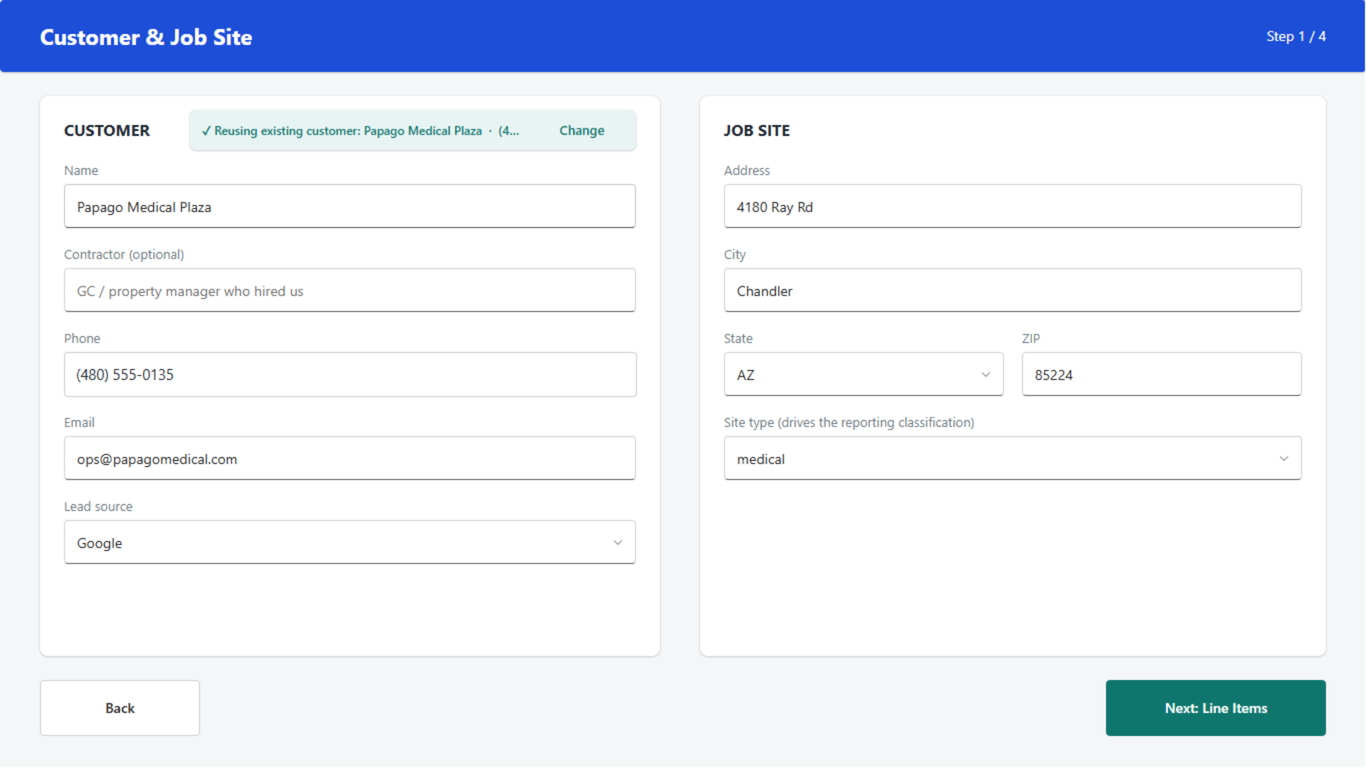
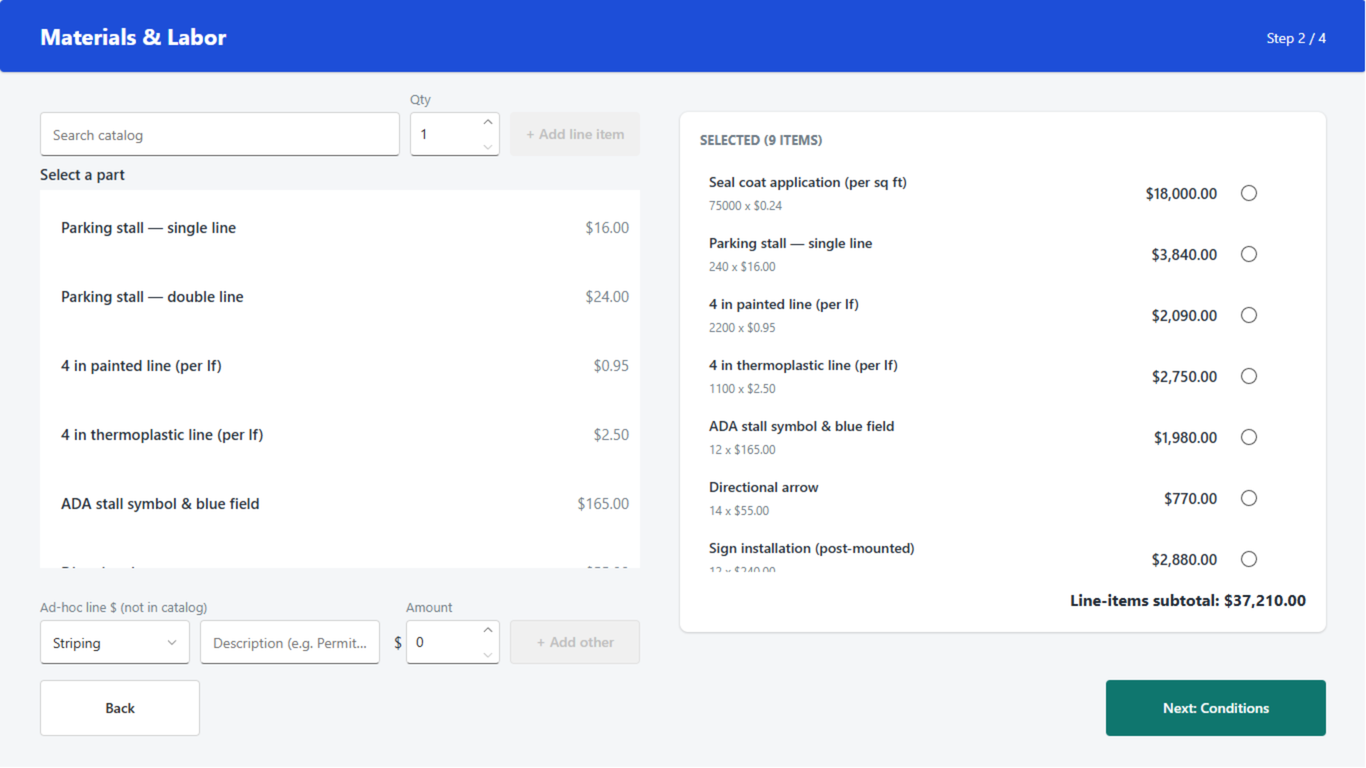
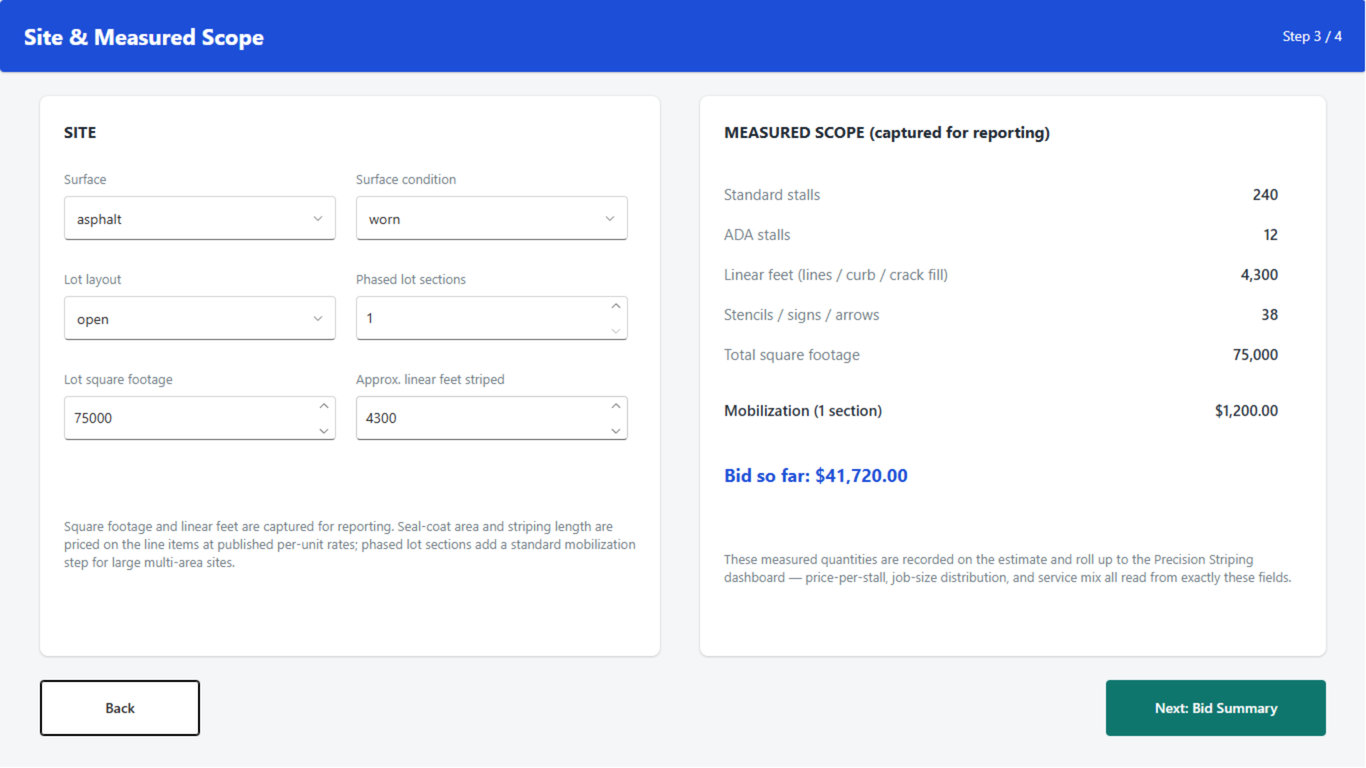
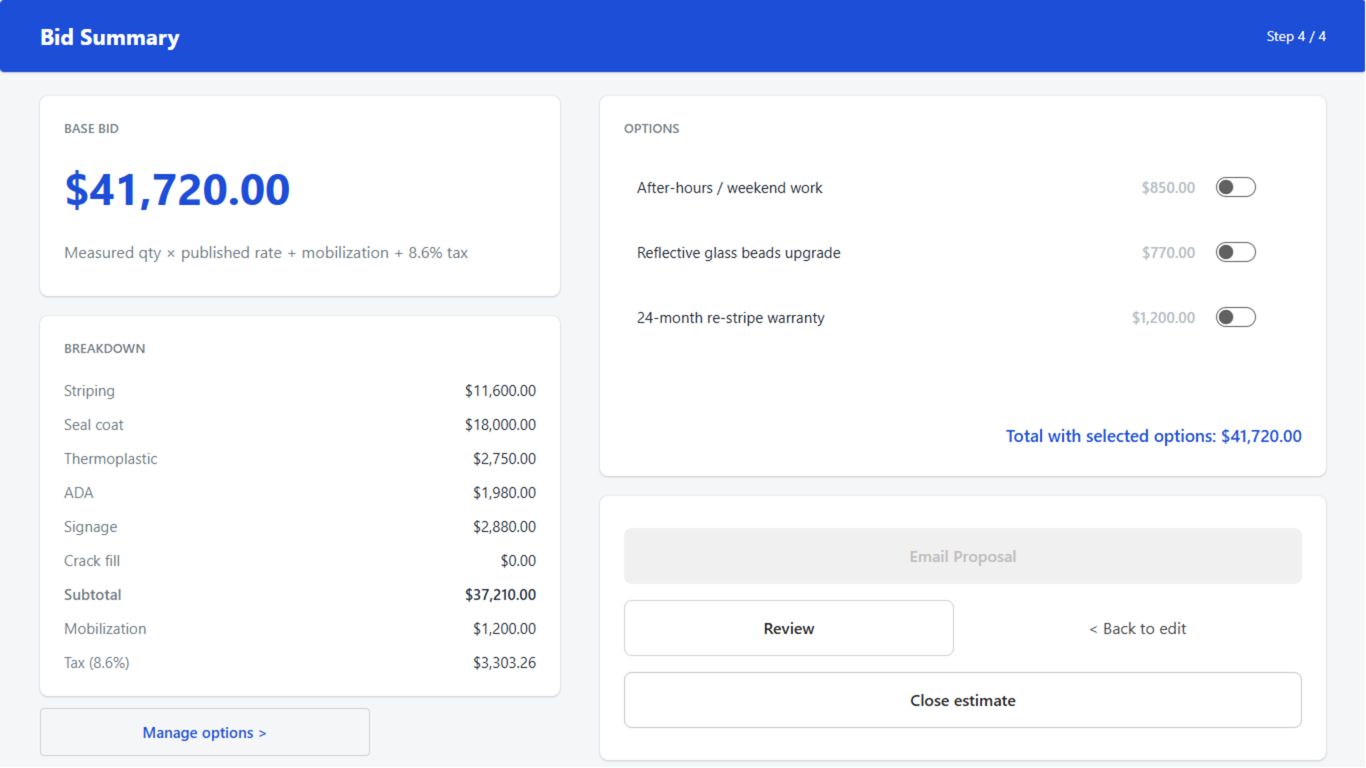
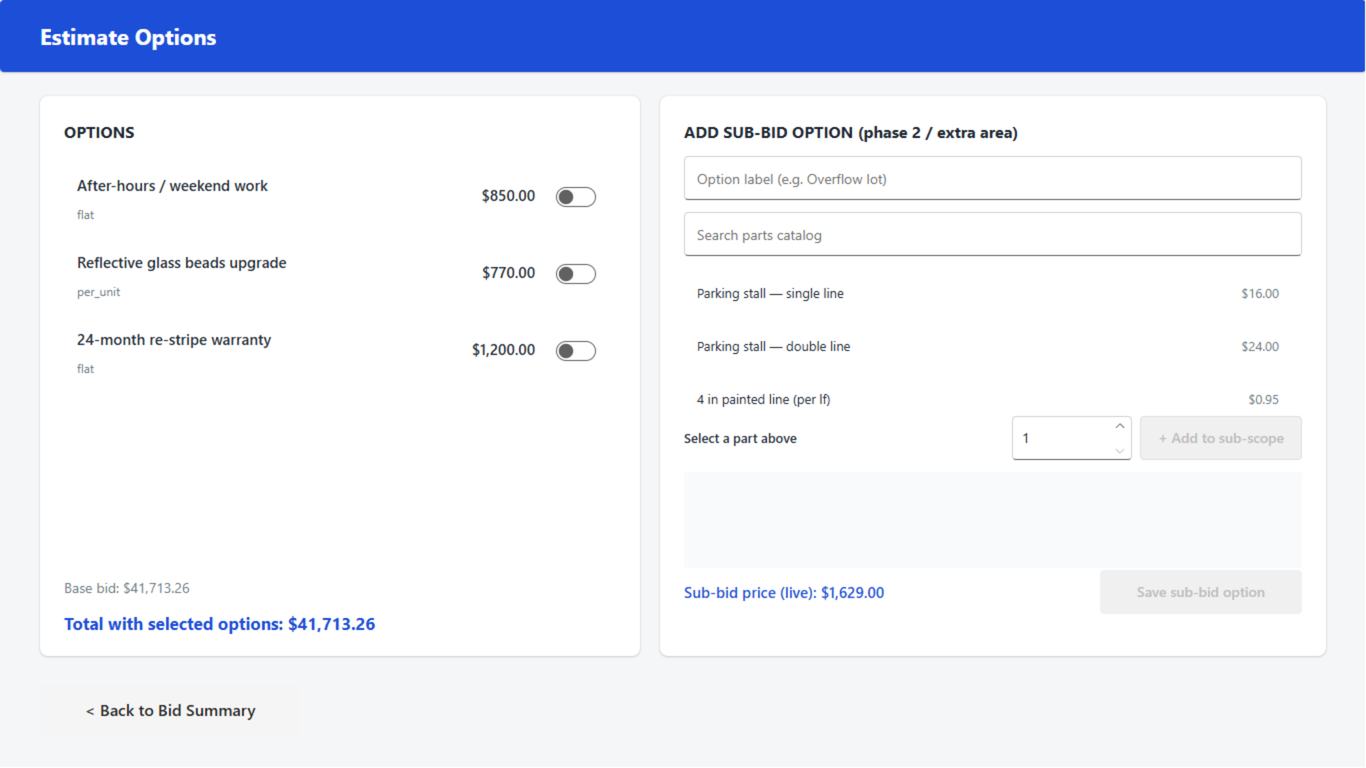
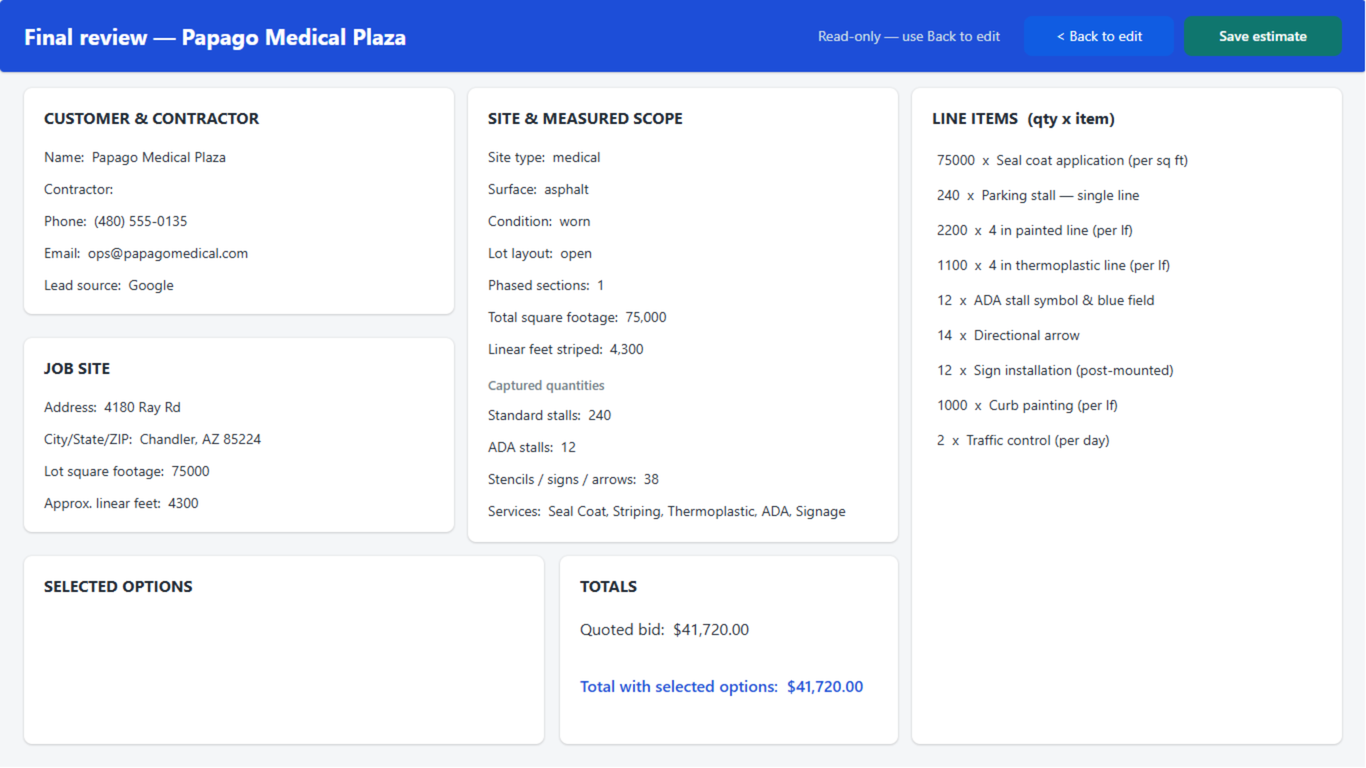
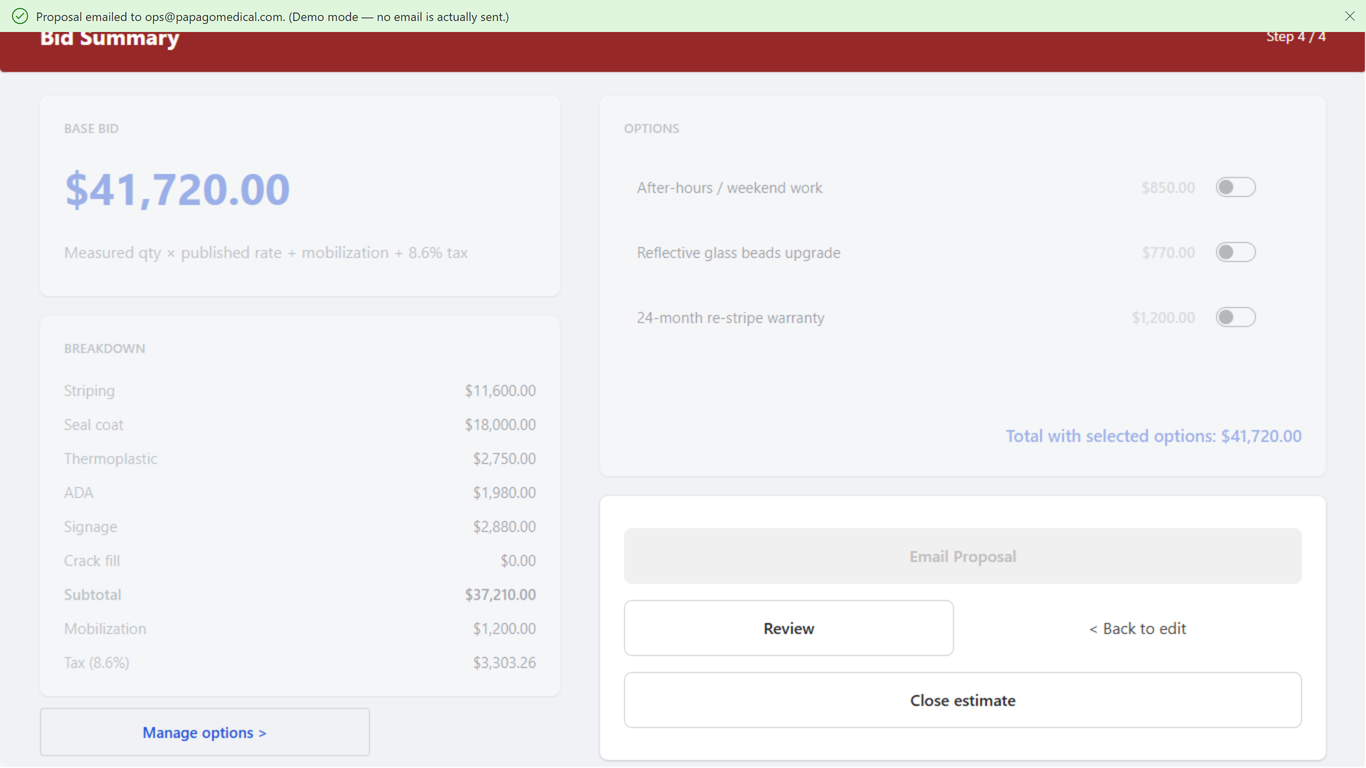
Step 1 of 8 — Estimate list. The whole pipeline in one list — status, customer, site, and price for every bid. Tap + New estimate to start one.
Send me this sample quote — no obligation
We'll email you the quote this tour just built — computed server-side with the same rate table the app uses. One email, no mailing list, nothing to unsubscribe from.
Your sample scope:
The AM2 Moment
What clarity changed
Same business, same team. Better visibility meant a few sharper calls — faster follow-up on estimates and receivables, a tighter read on job margins. On a ~$6M business, a few points is real money — which is why the dashboard pays for itself.
-
Days Sales Outstanding
42 days
76 days 42 days
-
Estimate win rate
47%
25% 47%
-
Operating margin
11%
5% 11%
-
Receivables past due
12%
72% 12%
This is what we build — your data, live and interactive, so every decision starts from truth.
Your turn
See this on your own numbers
Tell us your biggest numbers headache. On a free 30-minute call, we'll show you exactly what a live dashboard like this would look like on your business — and the fixed fee to make it yours.
Free 30-minute call, no obligation, no sales script — we reply within one business day. Prefer email? hello@am2analytics.com.
Here's what we'd build for you
- 01
We connect your data
QuickBooks, spreadsheets, your field app — wherever the numbers live today.
- 02
We model what drives decisions
Cash, margins, receivables, win rate — the figures you actually steer by.
- 03
You get a live dashboard you trust
One source of truth, on a fixed fee — the same kind you just explored.